Non-COVID deaths are still way higher than normal. Why? The increase in total deaths from all causes, not just COVID deaths, is up significantly By Edward Ring
https://amgreatness.com/2023/09/06/unexplained-excess-deaths-persist-in-post-covid-era/
According to data reported weekly by the CDC, the death rate in America remains elevated. In the six years prior to the COVID era, deaths in the United States averaged between 2.6 and 2.8 million people per year. These averages are adjusted for population growth, and with a population as large as the U.S., the numbers should be, and are, remarkably stable. During the three years immediately preceding the 2020, for example, the population growth adjusted death rate from all causes varied by only 1.5 percent.
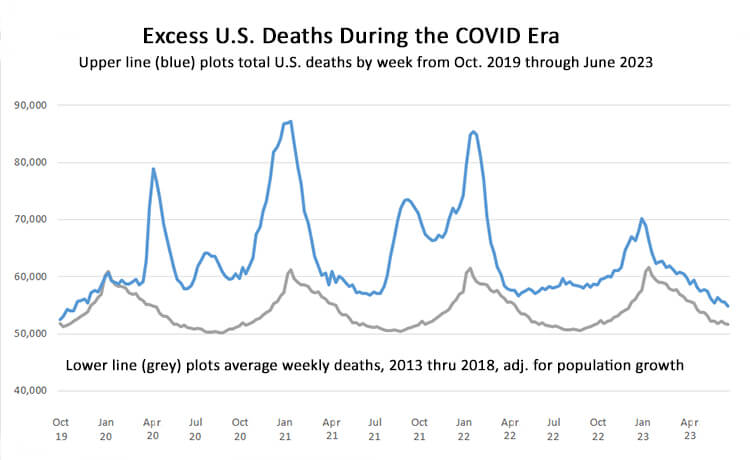
None of that is true today. The increase in total deaths – deaths from all causes, not just COVID deaths – is up significantly. If the period between October 2019 and June 2023 had adhered to predictable mortality rates, 10.5 million Americans would have died. Instead, during that period, 12.4 people died. This prolonged period of so-called excess deaths, 17 percent above normal, is only rivaled by the estimated 675,000 deaths from Spanish Flu in America in 1918-19 when the country had a much smaller population.
To illustrate how aberrant these grim statistics are, the chart below plots on a blue line the actual weekly deaths from all causes in the United States from the Fall of 2019 through the Spring of 2023. The grey line plots how many deaths would have occurred if mortality rates had adhered to predictable trends based on highly consistent statistics from the six prior years, 2013 through 2019. The data is indisputable, even if the causes remain mired in controversy. During the so-called COVID era, nearly 2.0 million people are dead who, if it had been normal times, would still be alive today.
There appears to be no end in sight, even though the horrific surges appear to be behind us. As shown on the right edges of the chart, going into the summer of 2023, weekly deaths from all causes remained persistently higher than normal. For example, during the last week of June, which is the most recent week for which there is reasonably complete reporting, 55,000 Americans died. Based on historical patterns, only 51,000 Americans would have died. Excess deaths in the U.S. are still about 7 percent above normal.

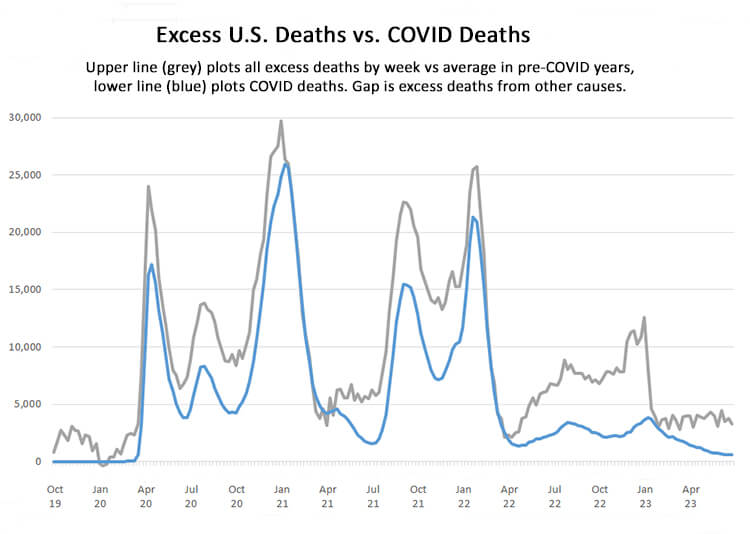
Equally, if not more alarming, even though the number of reported cases of COVID has been sharply down ever since the last major surge in January 2022, they now account for less than one in five of this persistent elevated death rate. Even during the first week of January 2023, when total deaths reached a yearly peak of 70,165 compared to a normal average estimate for that week of 57,545, only 3,656 of those 12,620 excess deaths were reported as COVID deaths. During the last week for which we have completed data, the week of June 26, 2023, of the estimated excess deaths of 3,265, only 566 were reported as caused by COVID.

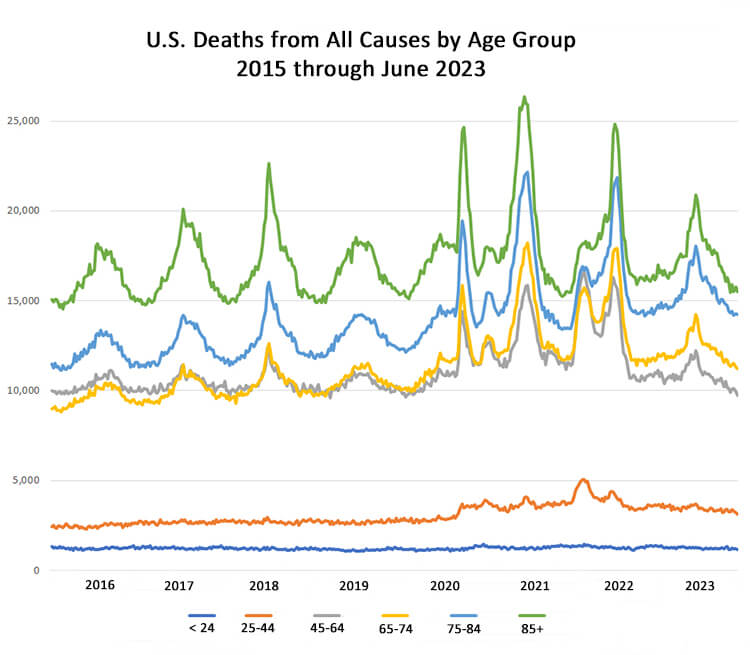
In an attempt to get an idea of who is dying, the next chart shows deaths by week for the period of January 2015 through June 2023, plotted by age group. The results are interesting. The most obvious observation is that the top two lines, which plot weekly deaths of people over 75 and over 85, respectively, account for the most deaths in the U.S., as would be expected. These two age groups also experienced the highest spikes in mortality during the COVID years. The next two lines, representing Americans from 65 to 74, and from 45 to 64 track remarkably close to each other up until the COVID years and don’t diverge sharply even during the COVID years.
To dive deeper into the trends among Americans over 45, notice where each line begins and ends. The very old Americans are dying today in about the same numbers as they were in 2015, as are Americans between 45 and 64. In the case of the 85+ Americans, the cause may be there simply aren’t as many of them left, since so many were lost during the COVID years. In the case of the 45-64 year olds, the return to normal may be attributable to their relative good health and resilience compared to their older counterparts. But notice the trend that applies for the 65-74 and the 75-84 year olds: The summertime low for 65-74 year olds in 2015 was around 9,000 per week, and today it is elevated to around 13,000 per week. Similarly, and in even more dramatic fashion, the summertime low for 75-84 year olds in 2015 was around 12,500 per week, and now it is all the way up to nearly 18,000 per week. Most of the persistent increase in the death rate can be found in Americans between 65 and 84.
For young Americans, two things are evident. First, during the COVID years there was a significant increase in the death rate among 25-44 year olds, and even though the numbers are relatively small, they are currently dying at a significantly greater percentage rate than in the pre-COVID years. Second, it is quite clear that for Americans under the age of 25, as shown in the virtually-horizontal plot at the bottom of the chart, COVID was of zero statistical significance, nor are they experiencing statistically relevant excess deaths today.

Wading through this data reduces to a sobering reality: Americans over the age of 65 are dying in numbers and at rates far in excess of what data from recent pre-COVID years would predict. These are not Americans that typically show up in the elevated drug overdose and homicide statistics. And at least according to the CDC, the vast majority of them are not dying of COVID.
Altogether, based on CDC statistics, the difference between excess deaths and deaths reported as COVID deaths in the United States over the past three years now exceeds 650,000. The percentage of excess deaths that are not recorded as COVID deaths has never been higher, and currently exceeds 80 percent. Without far more analysis, as well as the truths that will eventually emerge through the filter of history, it is sufficient to say excess deaths in the United States that aren’t caused by COVID might be primarily the sum of increases in suicides, murders, car accidents, drug overdoses, a disproportionately large number of 1946 babies reaching the limit of their life expectancy, and deferred diagnoses and deferred treatments.
Or it might be something else.
Comments are closed.
